Monitor
The cluster monitor shows information about all the Q clusters connected to your project.
Start the monitor with Django’s manage.py command:
$ python manage.py qmonitor
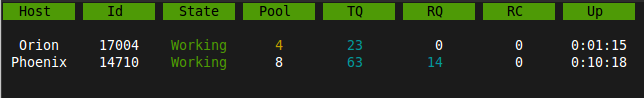
Legend
Host
Shows the hostname of the server this cluster is running on.
Id
The cluster Id. Same as the cluster process ID or pid.
State
Current state of the cluster:
- Starting The cluster is spawning workers and getting ready.
- Idle Everything is ok, but there are no tasks to process.
- Working Processing tasks like a good cluster should.
- Stopping The cluster does not take on any new tasks and is finishing.
- Stopped All tasks have been processed and the cluster is shutting down.
Pool
The current number of workers in the cluster pool.
TQ
Task Queue counts the number of tasks in the queue
If this keeps rising it means you are taking on more tasks than your cluster can handle.
RQ
Result Queue shows the number of results in the queue.
Since results are only saved by a single process which has to access the database. It’s normal for the result queue to take slightly longer to clear than the task queue.
RC
Reincarnations shows the amount of processes that have been reincarnated after a sudden death or timeout. If this number is unusually high, you are either suffering from repeated task errors or severe timeouts and you should check your logs for details.
Up
Uptime the amount of time that has passed since the cluster was started.
Press q to quit the monitor and return to your terminal.
Status
You can check the status of your clusters straight from your code with Stat:
from django_q.monitor import Stat

for stat in Stat.get_all():
    print(stat.cluster_id, stat.status)

# or if you know the cluster id
cluster_id = 1234
stat = Stat.get(cluster_id)
print(stat.status, stat.workers)
Reference
-
class
Stat¶ Cluster status object.
-
cluster_id
Id of this cluster. Corresponds with the process id.
-
tob
Time Of Birth
-
uptime()
Shows the number of seconds passed since the time of birth
-
reincarnations
The number of times the sentinel had to start a new worker process.
-
status
String representing the current cluster status.
-
task_q_size
The number of tasks currently in the task queue.
-
done_q_size
The number of tasks currently in the result queue.
-
pusher
The pid of the pushes process
-
monitor
The pid of the monitor process
-
sentinel
The pid of the sentinel process
-
workers
A list of process ids of the workers currently in the cluster pool.
-
empty_queues()
Returns true or false depending on any tasks still present in the task or result queue.
-
classmethod
get(cluster_id, r=redis_client)
Gets the current
Statfor the cluster id. Takes an optional redis connection.-
classmethod
get_all(r=redis_client)
Returns a list of
Statobjects for all active clusters. Takes an optional redis connection.-

